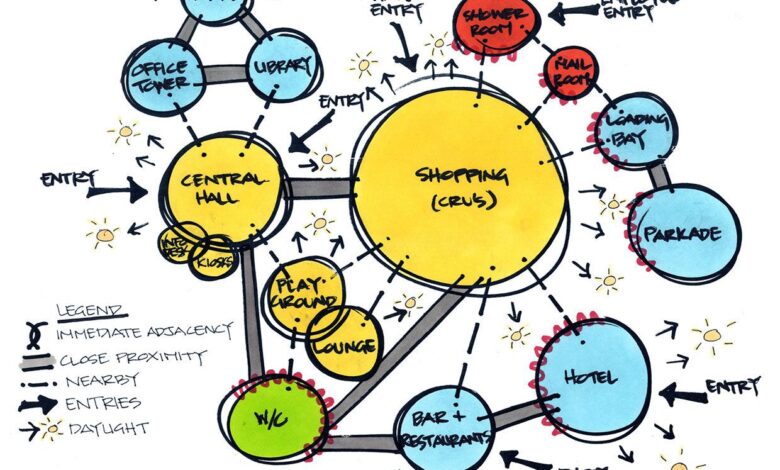
Bubble Diagram: A Comprehensive Guide to Visualizing Ideas and Concepts

bubble diagram In today’s fast-paced world, the ability to organize and present ideas clearly is essential. Whether you’re brainstorming, planning a project, or simply trying to make sense of a complex concept, visual tools can significantly improve your understanding and communication. One such tool is the bubble diagram. This simple yet powerful diagram type is used for everything from mapping out ideas to designing systems. In this article, we’ll dive deep into the world of bubble diagrams, exploring how they work, how to create them, and the many ways they can be used to enhance your productivity and creativity.
What Is a Bubble Diagram?
The Basics of a Bubble Diagram
A bubble diagram is a visual representation of ideas, concepts, or relationships between various elements. It typically consists of circles (bubbles) that represent different ideas, which are connected by lines or arrows to show how they relate to each other. The central idea or topic is usually placed in the center, with related subtopics surrounding it. The connections between the bubbles help to map out the flow or hierarchy of information, making it easier to understand complex relationships.
At its core, the bubble diagram is all about simplicity and clarity. The circles or bubbles are easy to create, and the relationships between them are clearly shown through simple lines. This straightforward visual format makes bubble diagrams an ideal tool for brainstorming sessions, concept mapping, and organizing thoughts for presentations, projects, or studies.
Types of Bubble Diagrams
Bubble diagrams can take on various forms depending on their purpose and the field of application. For instance, concept maps are often used in educational settings to represent knowledge and relationships between concepts. These diagrams show how different pieces of information are connected to a central idea, helping learners better understand complex subjects.
Another type is the mind map, which is often used for brainstorming and idea generation. Mind maps focus on free-flowing creativity, where the central idea expands outward, with each new bubble representing a related thought or subtopic. Finally, process diagrams are used in fields such as software development and business management to map out steps, tasks, or processes in a logical, interconnected manner.
Applications of Bubble Diagrams
Bubble diagrams are incredibly versatile and can be used in various industries and fields. In education, they help students visualize how different ideas and concepts are interconnected, making learning easier. Teachers often use bubble diagrams to explain complex topics in a simplified way, such as breaking down a historical event into cause-and-effect relationships.
In business, bubble diagrams are often employed during the planning phase of a project or when developing strategies. For example, a project manager might use a bubble diagram to visualize tasks, timelines, and dependencies. This helps to break down large projects into manageable pieces, making it easier to track progress and identify potential bottlenecks.
In design and architecture, bubble diagrams are used to represent spatial relationships. An architect might create a bubble diagram to show how different rooms in a building should be arranged based on their functions and interactions. This kind of diagram is often used in the early stages of a project before the final plans are drawn up.
How to Create a Bubble Diagram
Tools and Software for Creating Bubble Diagrams
While bubble diagrams can be drawn by hand, digital tools offer numerous advantages, including flexibility, ease of sharing, and the ability to quickly make adjustments. Several tools are available to help create professional-quality bubble diagrams. Lucidchart is one of the most popular options. This web-based tool allows users to create various types of diagrams, including bubble diagrams, with a simple drag-and-drop interface. It also includes templates that make the creation process even easier.
Another widely used tool is MindMeister, a mind mapping software that lets users organize ideas into bubbles, making it ideal for brainstorming sessions. For those who prefer a free alternative, Canva offers an intuitive diagramming tool that includes customizable templates for creating bubble diagrams. Canva is particularly user-friendly and is great for people with little to no design experience.
If you prefer to work offline, software like Microsoft PowerPoint or Google Slides can also be used to create bubble diagrams. These tools allow you to draw shapes, add text, and connect ideas with lines, providing a simple solution for creating diagrams quickly.
Step-by-Step Process to Create a Bubble Diagram
Creating a bubble diagram is straightforward and can be done in just a few steps. Here’s a simple process to guide you:
Step 1: Identify the Central Idea or Topic
Start by identifying the main idea or concept that you want to explore. This central idea will be placed in the middle of the diagram. It could be a specific problem you’re trying to solve, a topic you want to brainstorm, or an issue you’re organizing.
Step 2: Add Related Subtopics Around the Central Idea
Next, think about the subtopics or related ideas that connect to the central theme. These will form the surrounding bubbles. For example, if your central idea is “Marketing Strategy,” related subtopics could include “Social Media,” “SEO,” “Content Marketing,” and “Email Campaigns.”
Step 3: Connect Ideas Using Lines or Arrows
Draw lines or arrows between the central idea and its subtopics. These connections represent the relationships between the ideas. In more complex diagrams, you can create additional levels of subtopics and connect them to their respective bubbles.
Step 4: Refine and Group Similar Ideas
Look for connections between subtopics and group similar ideas together. For instance, if “SEO” and “Content Marketing” are closely related, they can be grouped into one larger bubble. This step helps to create a cleaner, more organized diagram.
Step 5: Finalize and Customize
Finally, customize your diagram by adjusting the size and color of the bubbles, adding labels, and organizing the layout for clarity. The goal is to make the diagram visually appealing and easy to understand.
Tips for Effective Bubble Diagrams
To make sure your bubble diagram is clear and effective, keep the following tips in mind:
- Use Simple Language: Label each bubble with concise, easy-to-understand terms.
- Limit the Number of Bubbles: Too many bubbles can make your diagram overwhelming. Stick to the most essential ideas to keep things clear.
- Be Consistent: Use consistent shapes, colors, and fonts to make the diagram visually harmonious.
- Keep It Simple: The power of a bubble diagram lies in its simplicity. Avoid overcomplicating it with too much detail or too many connections.
Benefits of Using Bubble Diagrams
Organizing Complex Information
One of the main benefits of using a bubble diagram is its ability to organize complex information. It allows you to break down large, intricate topics into manageable chunks, making it easier to understand the relationships between different elements. For example, when planning a marketing campaign, a bubble diagram can help organize the various components, such as social media, content creation, and email marketing, and show how each piece fits into the overall strategy.
By visualizing the connections between ideas, you can quickly identify patterns and gaps in your knowledge. This clarity is invaluable when trying to solve complex problems or generate new ideas.
Enhancing Creativity and Brainstorming
Bubble diagrams are also great tools for enhancing creativity. When brainstorming ideas, it’s easy to feel overwhelmed by the sheer volume of thoughts you need to organize. A bubble diagram helps by providing a clear structure for your ideas to flow freely without becoming tangled. This allows you to think outside the box and explore connections between unrelated ideas.
The visual format of a bubble diagram stimulates your brain, encouraging new insights and helping you see things from a different perspective. By laying out your ideas in a structured yet flexible format, you open up the possibility for creative solutions and innovative approaches.
Improved Problem-Solving and Decision Making
Bubble diagrams play a significant role in problem-solving and decision-making. They help you break down a problem into its component parts, making it easier to identify the root causes and potential solutions. For example, if you’re troubleshooting a technical issue, a bubble diagram can map out possible causes and their corresponding solutions, allowing you to systematically test each one.
In decision-making, a bubble diagram helps you weigh the pros and cons of different options by visually representing the potential outcomes. This methodical approach enables you to make more informed choices and reduce the risk of overlooking key factors.
Simplifying Communication
In business and other professional settings, clear communication is vital. A bubble diagram is an excellent tool for presenting complex ideas in a simple, easy-to-understand format. By using visual elements like shapes and arrows, you can communicate information quickly and effectively, even to those with little to no background knowledge on the topic.
Whether you’re giving a presentation to your team, explaining a project to a client, or teaching a concept to students, a bubble diagram helps convey your message with clarity and impact.
Real-World Applications of Bubble Diagrams
In Education
Bubble diagrams are widely used in education to help students organize their thoughts and understand complex subjects. Teachers often use them to explain relationships between different concepts, making it easier for students to grasp difficult material. For example, in history lessons, a bubble diagram can show how various events are connected, helping students understand the cause-and-effect relationships between them.
Additionally, bubble diagrams are used in brainstorming and collaborative activities. Students can work together to create diagrams that explore different viewpoints, fostering teamwork and critical thinking.
In Business
In business, bubble diagrams are used in project management, strategic planning, and team collaboration. A project manager might create a bubble diagram to map out all the tasks involved in a project, as well as the dependencies between them. This makes it easier to identify potential delays and streamline the project workflow.
Businesses also use bubble diagrams to design processes and workflows. By mapping out the steps involved in a task, companies can improve efficiency and reduce the likelihood of errors. Bubble diagrams can also be used to visualize company structures, helping employees understand their roles and relationships within the organization.
In Software Development
Bubble diagrams are often used in software development to map out the structure and flow of systems. For instance, a developer might use a bubble diagram to visualize how different modules of a software application interact with one another. This helps identify potential issues in the system and provides a clearer understanding of how the application functions as a whole.
In Personal Development
Bubble diagrams are also an excellent tool for personal development. Whether you’re setting goals or planning your career, a bubble diagram helps you map out your aspirations and the steps you need to take to achieve them. By visually representing your goals and priorities, you can stay focused and motivated to reach your desired outcomes.
Conclusion
In conclusion, bubble diagrams are a powerful tool for organizing thoughts, visualizing complex relationships, and fostering creativity. Whether you’re brainstorming, planning a project, or trying to simplify a difficult concept, bubble diagrams can help you break down information and communicate it more clearly. By learning how to create and use bubble diagrams effectively, you can improve your problem-solving skills, enhance your creativity, and simplify communication in both personal and professional settings.


